An intuitive network monitoring app that provides real-time insights into network performance
The main capabilities of Sipmon mobile are
See your resources current status: hosts & services
Filter resources list
View Timeline details of both host and service
See detail information of host or service
Access metrics history via charts
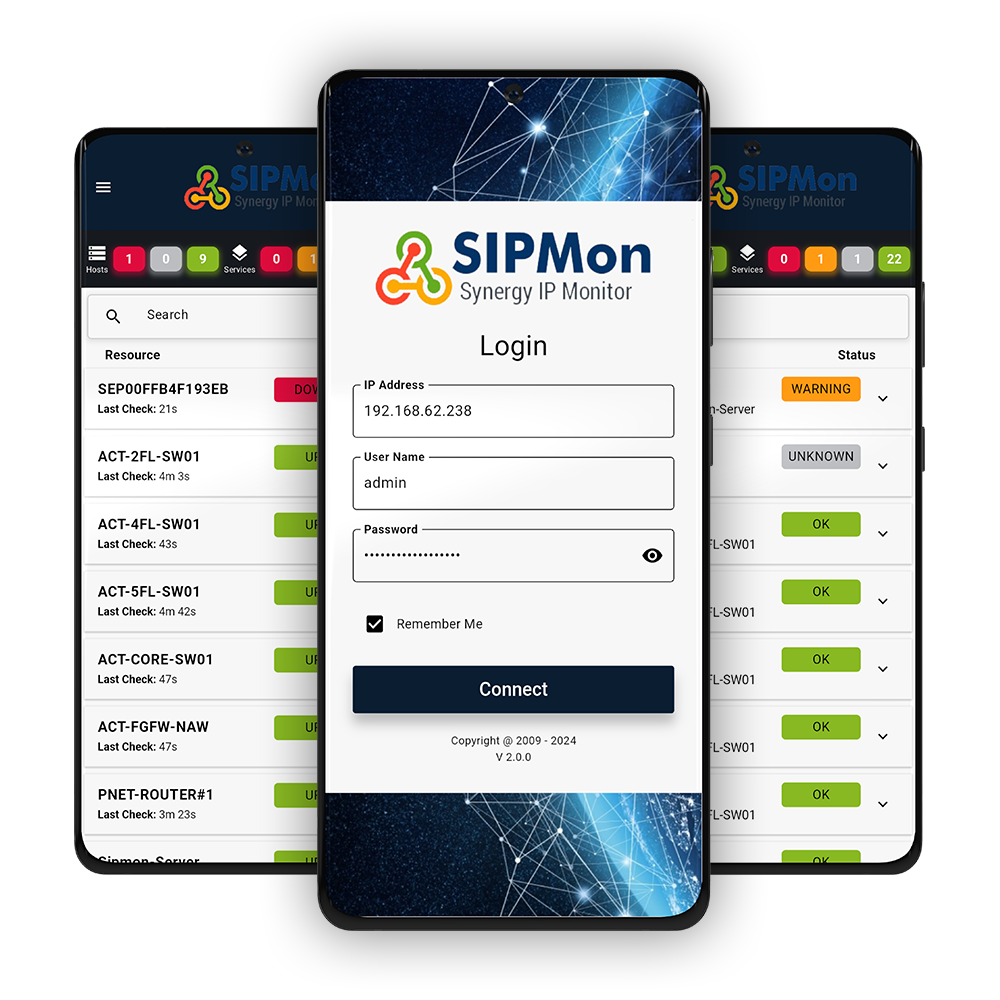
How to connect
When logging in for the first time, you need to fill the following parameters
IP Address: IP Address to connect to your Sipmon platform.
User Name: Type your username to connect to Sipmon
Password: Type the password to connect to Sipmon
Features
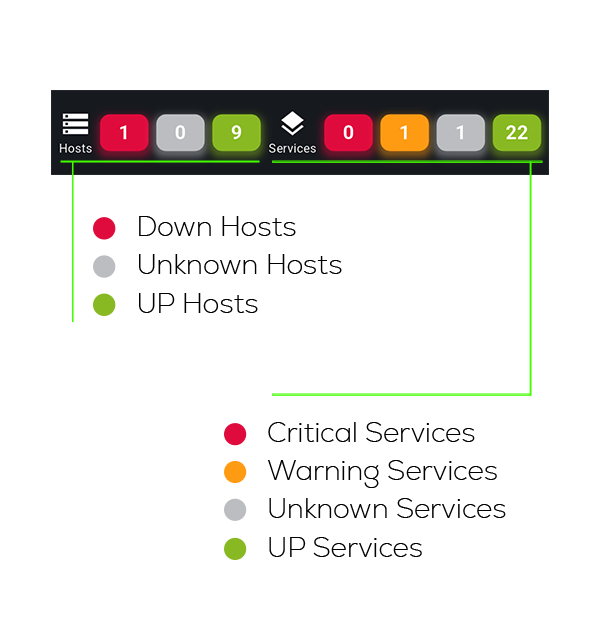
Count Tab
With SIPMon Mobile, you can see the Count Tab at the top of the app screen. With this tab, you can get countable values, and you can filter each item by pressing the count buttons.
This tab has two main sections:
Hosts Section
Services Section
Hosts Section
In the Hosts Section, you can view all hosts by pressing the Host icon. The Host Section has three buttons to filter each state:
Down State Hosts ( Red color)
Unknown State Hosts ( Gray color)
Up State Hosts ( Green color)
Hosts Section
In the Services Section, you can view all services by pressing the Services icon. The Services Section has four buttons to filter each state:
Down State Hosts ( Red color)
Warning State Hosts ( Orange color)
Unknown State Hosts ( Gray color)
Up State Hosts ( Green color)
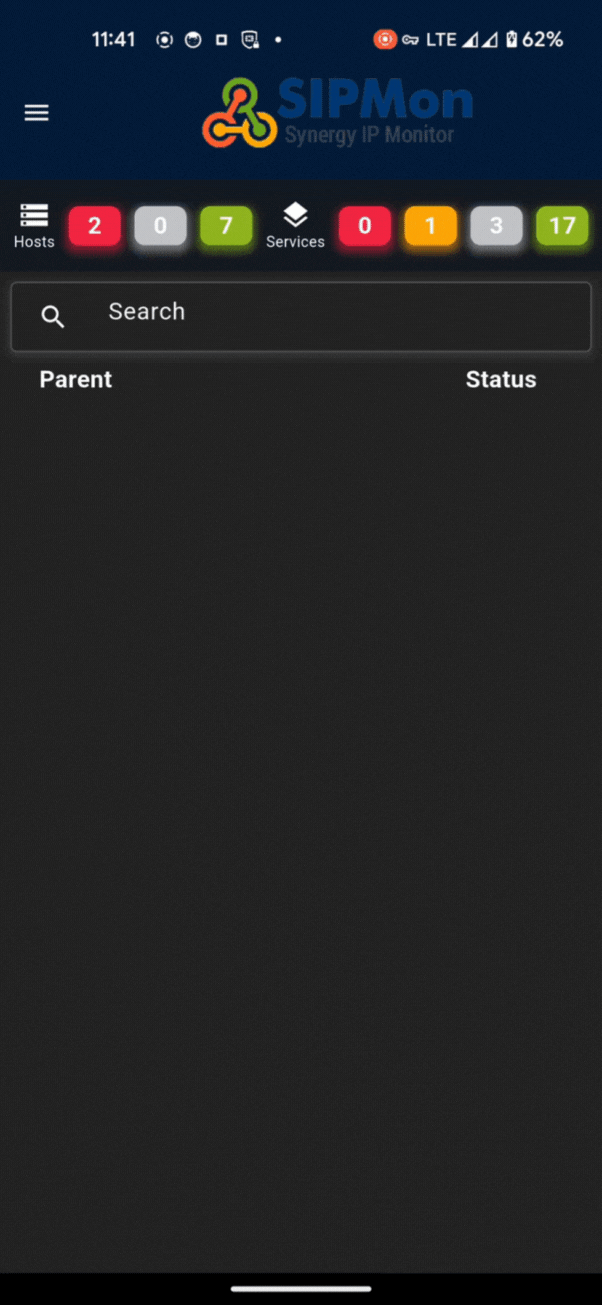
Live Search
SIPMon’s Mobile Network Monitoring System introduces Live Search, a powerful and intuitive feature designed to simplify network management. With Live Search, users can effortlessly locate hosts, services in real time.
Details View
The Host section allows users to monitor essential metrics for network hosts. It displays the timestamp of the Last Check, the total Duration since the host’s state last changed, detailed Information about the current status, and the number of Tries attempted to check the host. This ensures that users have all the data needed to assess host stability and performance.
The Service section provides comprehensive data on network services. Users can view resource utilization under Resources, the Last Check timestamp, the total Duration since the last state change, detailed Information about service performance, and the number of Tries made to verify the service status. This detailed monitoring helps maintain service reliability and optimize resource usage.
Timeline View
The Timeline View allows users to monitor events for both Hosts and Services. It includes three key components:
Date & Time Picker
Enables users to select a custom date and time range to view specific timeline data.
Category Filter
Allows users to filter timeline data by one or more categories:
Status
Notification
Comment
Acknowledgement
Downtime
Timeline Data Preview
Displays all relevant timeline data based on the selected date range and applied filters.
With these tools, users can effectively customize and analyze event timelines to suit their monitoring needs.

 copy")
")