For Application Monitoring
SIPAPM is an APM (Application Performance Management) tool for large-scale distributed systems written in Java / PHP. Inspired by Dapper,
SIPAPM provides a solution to help analyze the overall structure of the system along with SIPMon NMS and how components within them are interconnected by tracing transactions across distributed applications.
SIPAPM is for Application Monitoring. Allows you to monitor Java and PHP based applications all the way to code level errors.
Also by deploying SIPMon APM, along with SIPMon NMS or SIPMon SD NMS, together, these 2 solutions will allow you to drill down from Application Level errors to all the way down to Database or Network or Device level to pinpoint where errors are arising from saving valuable engineering time as ball passing between application teams to database teams to networking teams will stop.
Key benefits of using SIPAPM
What is APM?
Background
In the modern IT era, there are more and more applications under the distributed microservice and distributed architecture. The number of users also increases millions explosively, facing various complex application exceptions which are highly critical to application performance. In traditional application mode, metrics of multiple traditional systems cannot be associated for analysis. Analysis personnel need to check application exceptions one by one based on experience, resulting in low efficiency, costly maintenance, and poor stability even with lot of dependencies.
For massive services which treats millions of transactions per hour, Analysis personnel face the following challenges:
Large distributed applications have complex relationships, making it difficult to analyze and locate problems and quit complex dependencies
Specifically, Analysis personnel face problems such as how to ensure normal application running, and quickly locate faults and performance bottlenecks in all layers as Application, Network, Network Devices or backend devices like DB servers.
Users choose to leave due to poor experience. Analysis personnel fail to detect and track services with poor experience in real time, and cannot diagnose application exceptions in a timely manner, severely affecting user experience.
Answer
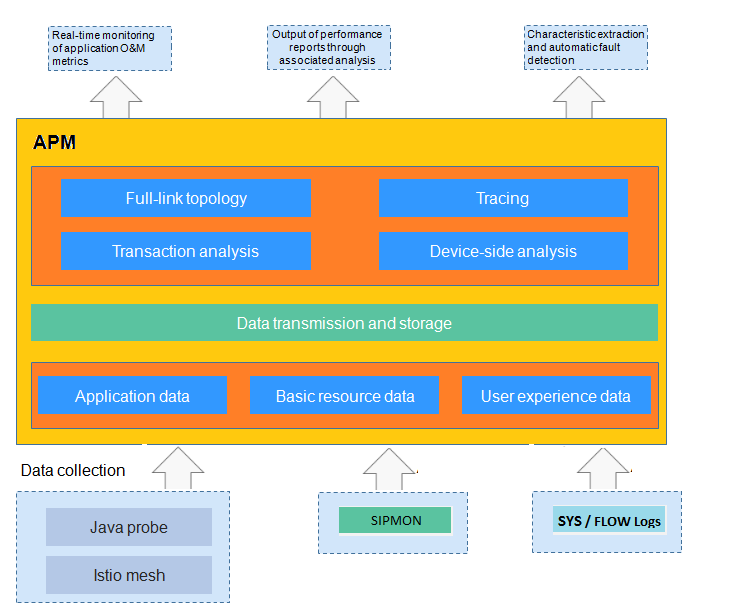
Application Performance Management (APM) monitors and manages the performance of cloud based applications in real time.
It also incorporates with SIPMON advanced NMS to assure other layers as Application, Network, Network Devices or backend devices like DB servers.
APM provides performance analysis of distributed applications, helping to quickly locate and resolve faults and performance bottlenecks.
As a cloud application diagnosis service, APM has powerful analysis tools and it is purely driven by latest BIGDATA architecture.
It displays the Network status, Hardware Status, application status, call processes, and user operations through topologies, tracing, and transaction analysis, so that you can quickly locate and resolve faults and performance bottlenecks.